
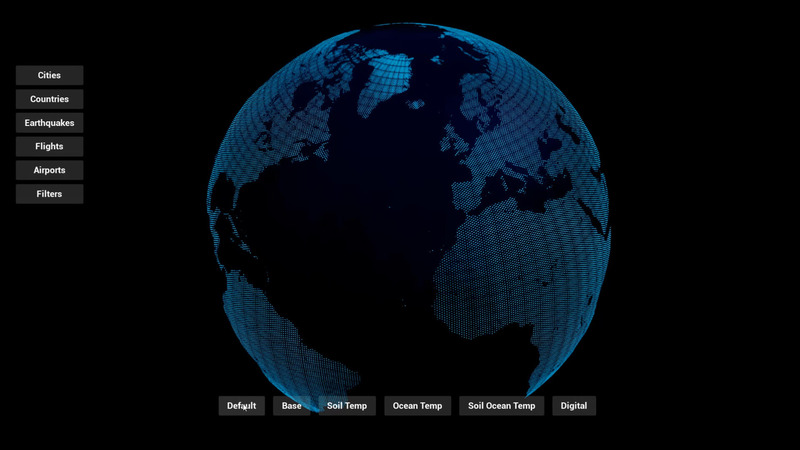
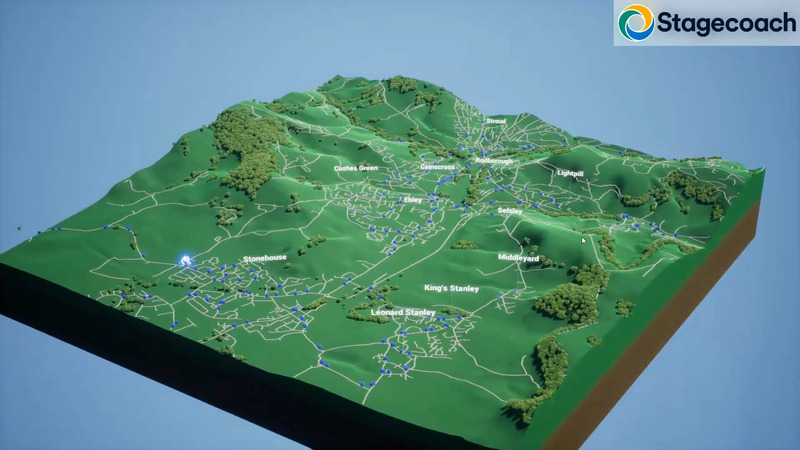
- Accurate geolocation datasets
- Realtime API aviation datasets
- Historical datasets
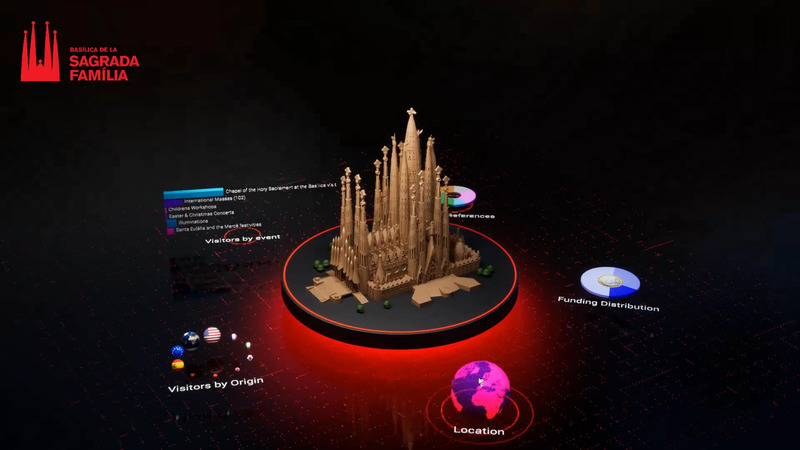
- Fully interactive
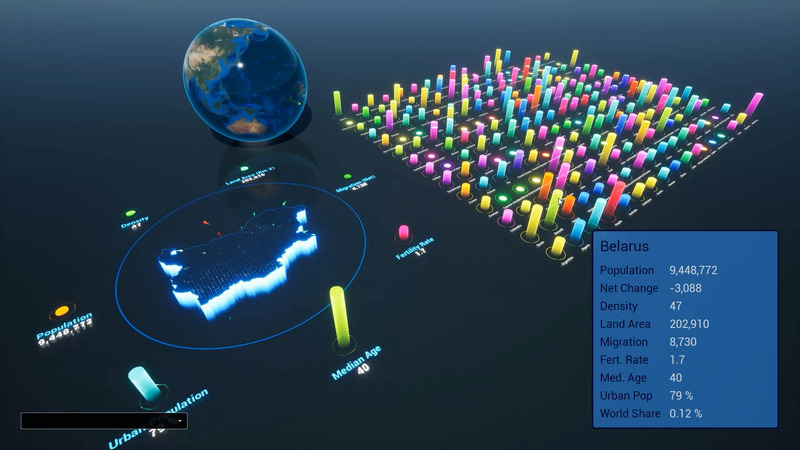

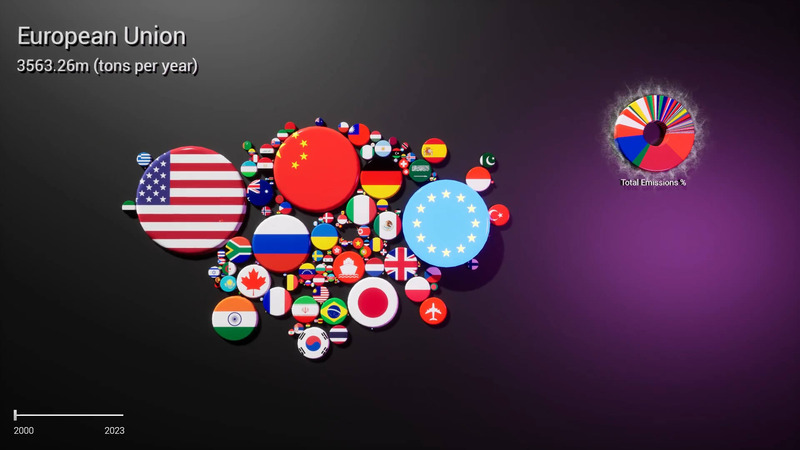
Data Visualisation
Making sense of data is key to sucessful decision making, spotting trends & patterns, analysis and for educational purposes
We create exciting data oriented visual representations to help tell narratives, bring data to life and allow users to explore discover at their own pace
Visually exciting & dynamic data, often increases the chance for users to understand the meaning in the data as well as gather contextualised insights
Data updated in realtime to reflect live data
Accurate geo locational data
Digital dashboards
Fully interactive data visualisations
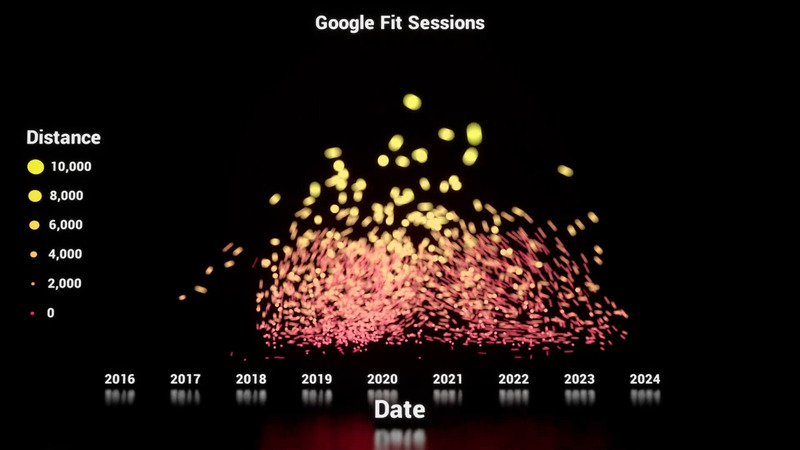
Abstract data representations
Large datasets turned comprehensible
API datasets